GeoAlert
Visualize Natural Events Like Earthquake, and use the built-in tools to analyze the data
Go To AppAvailable Datasets
Earthquake
GeoAlert allows you to analyze all the earthquake data from 2000-2024. The data was fetched from USGS’s public API
How To Use
Step2:
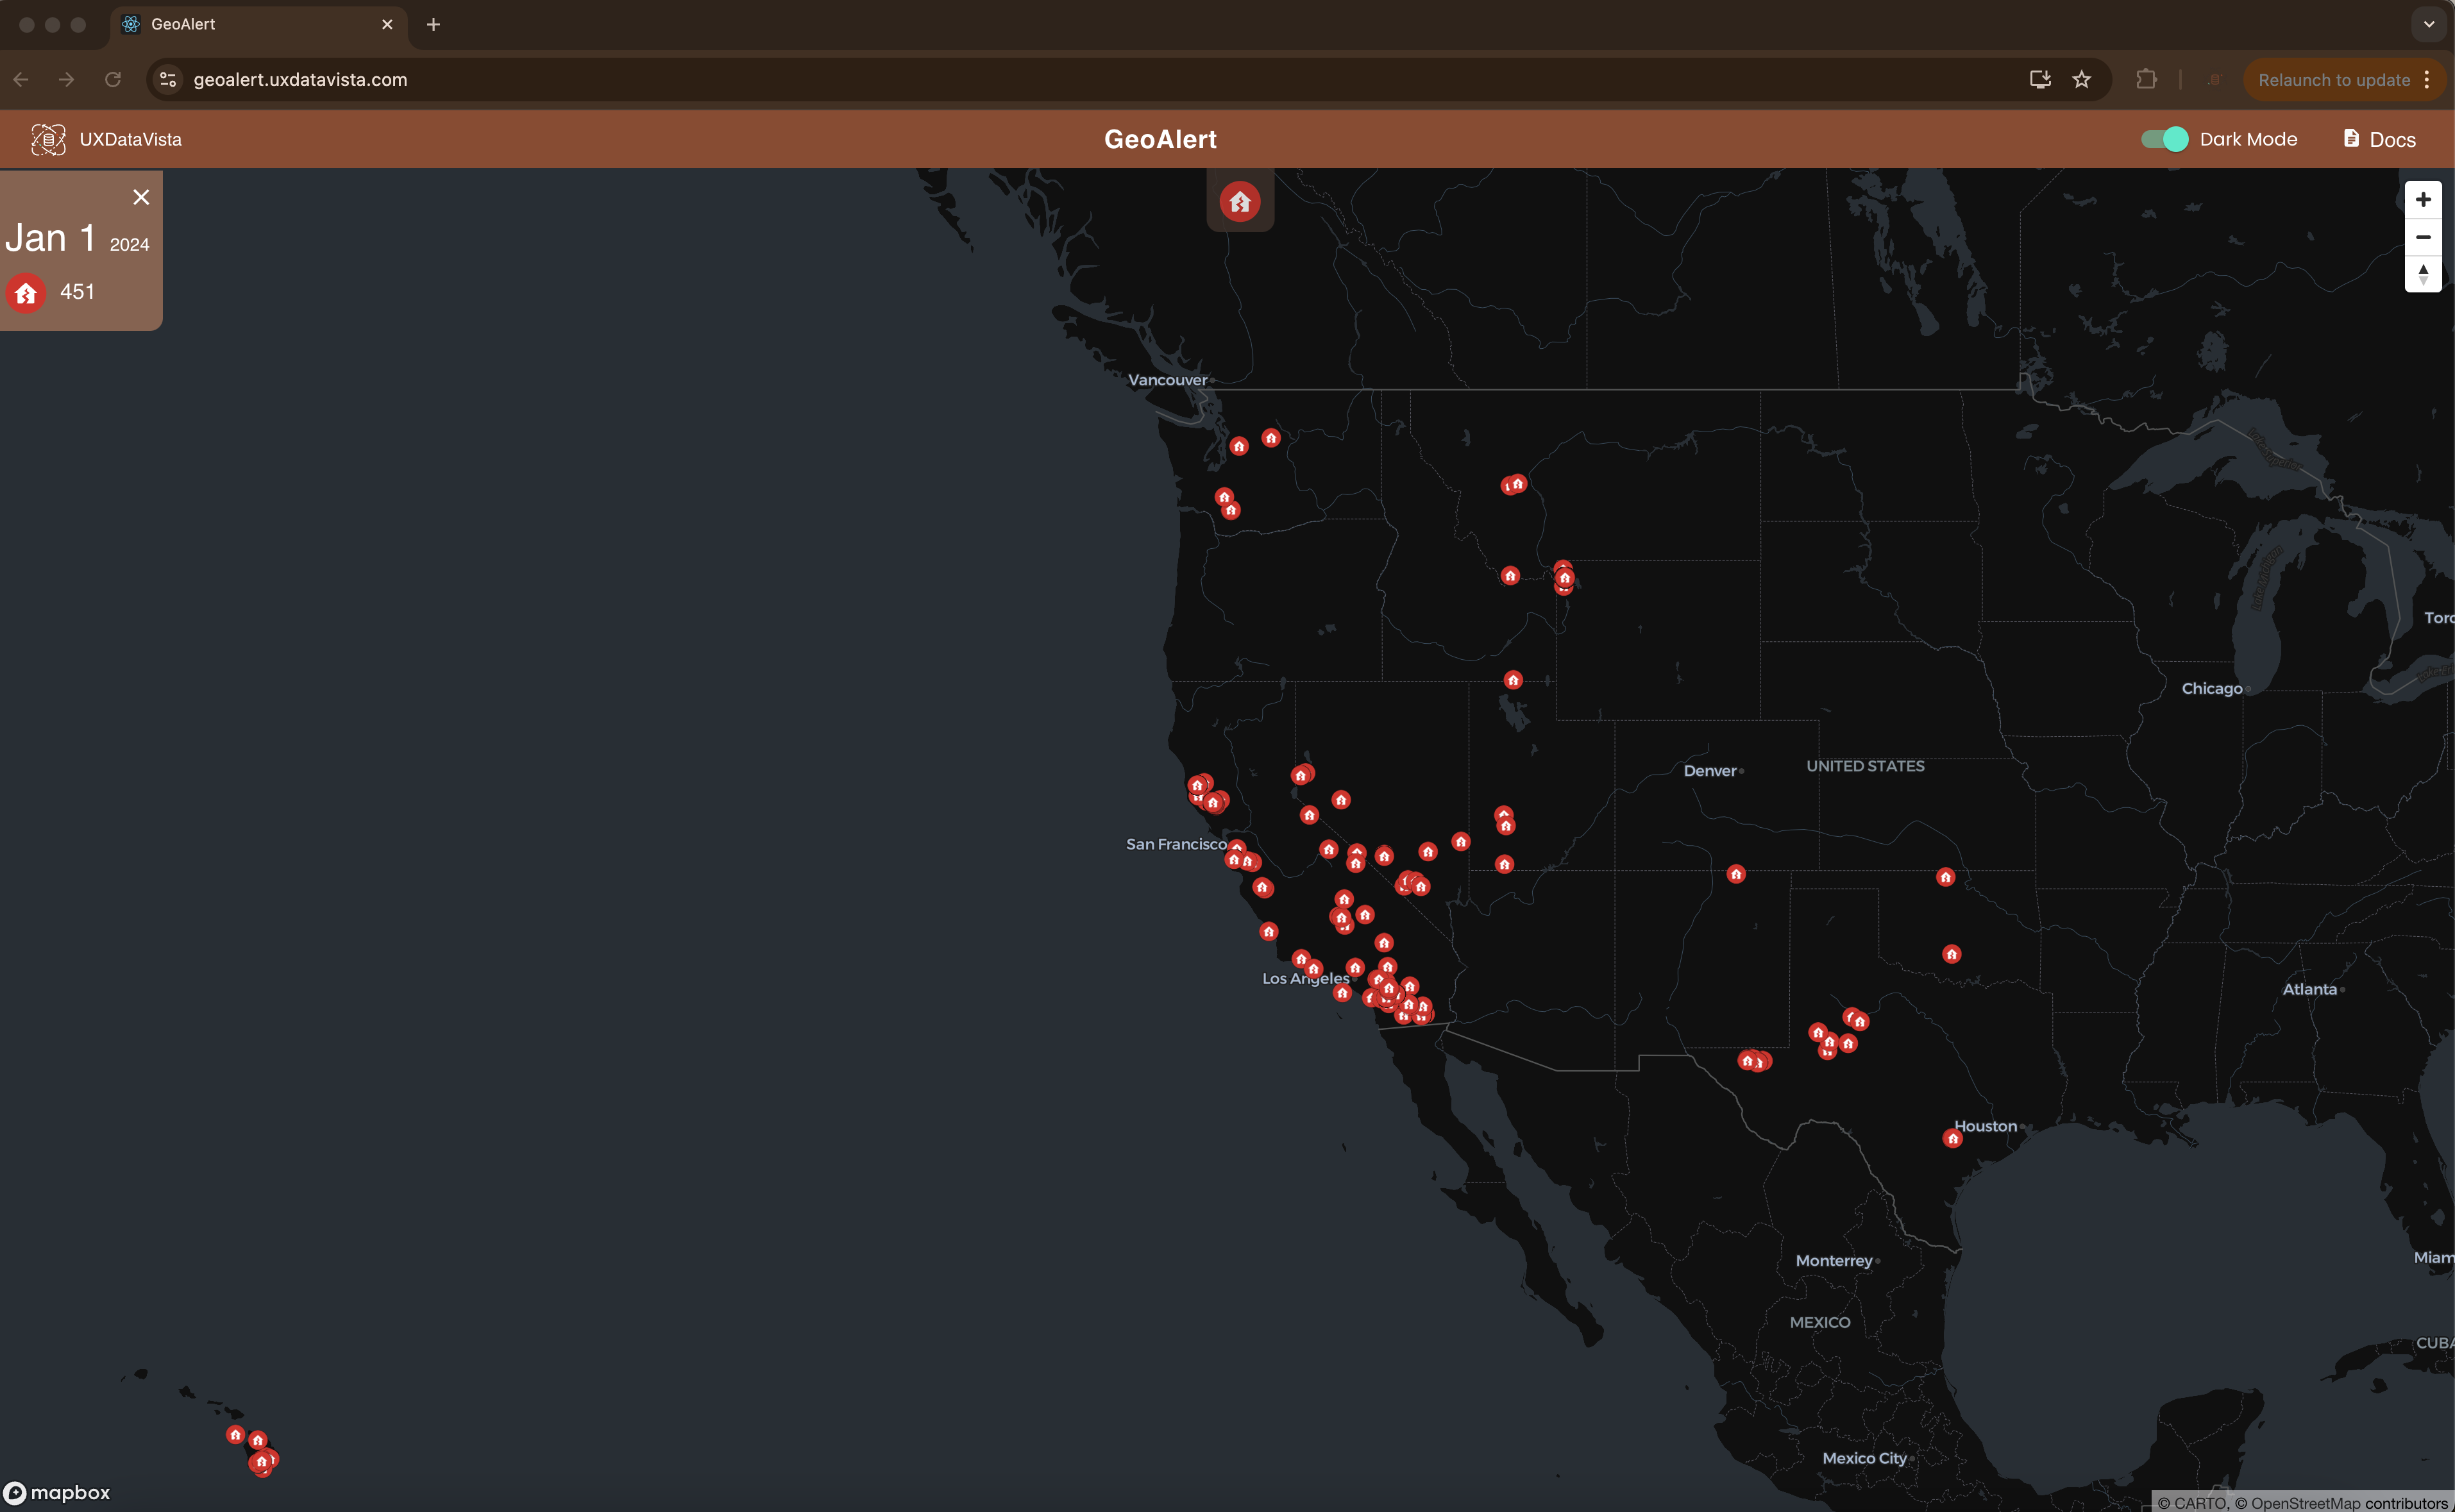
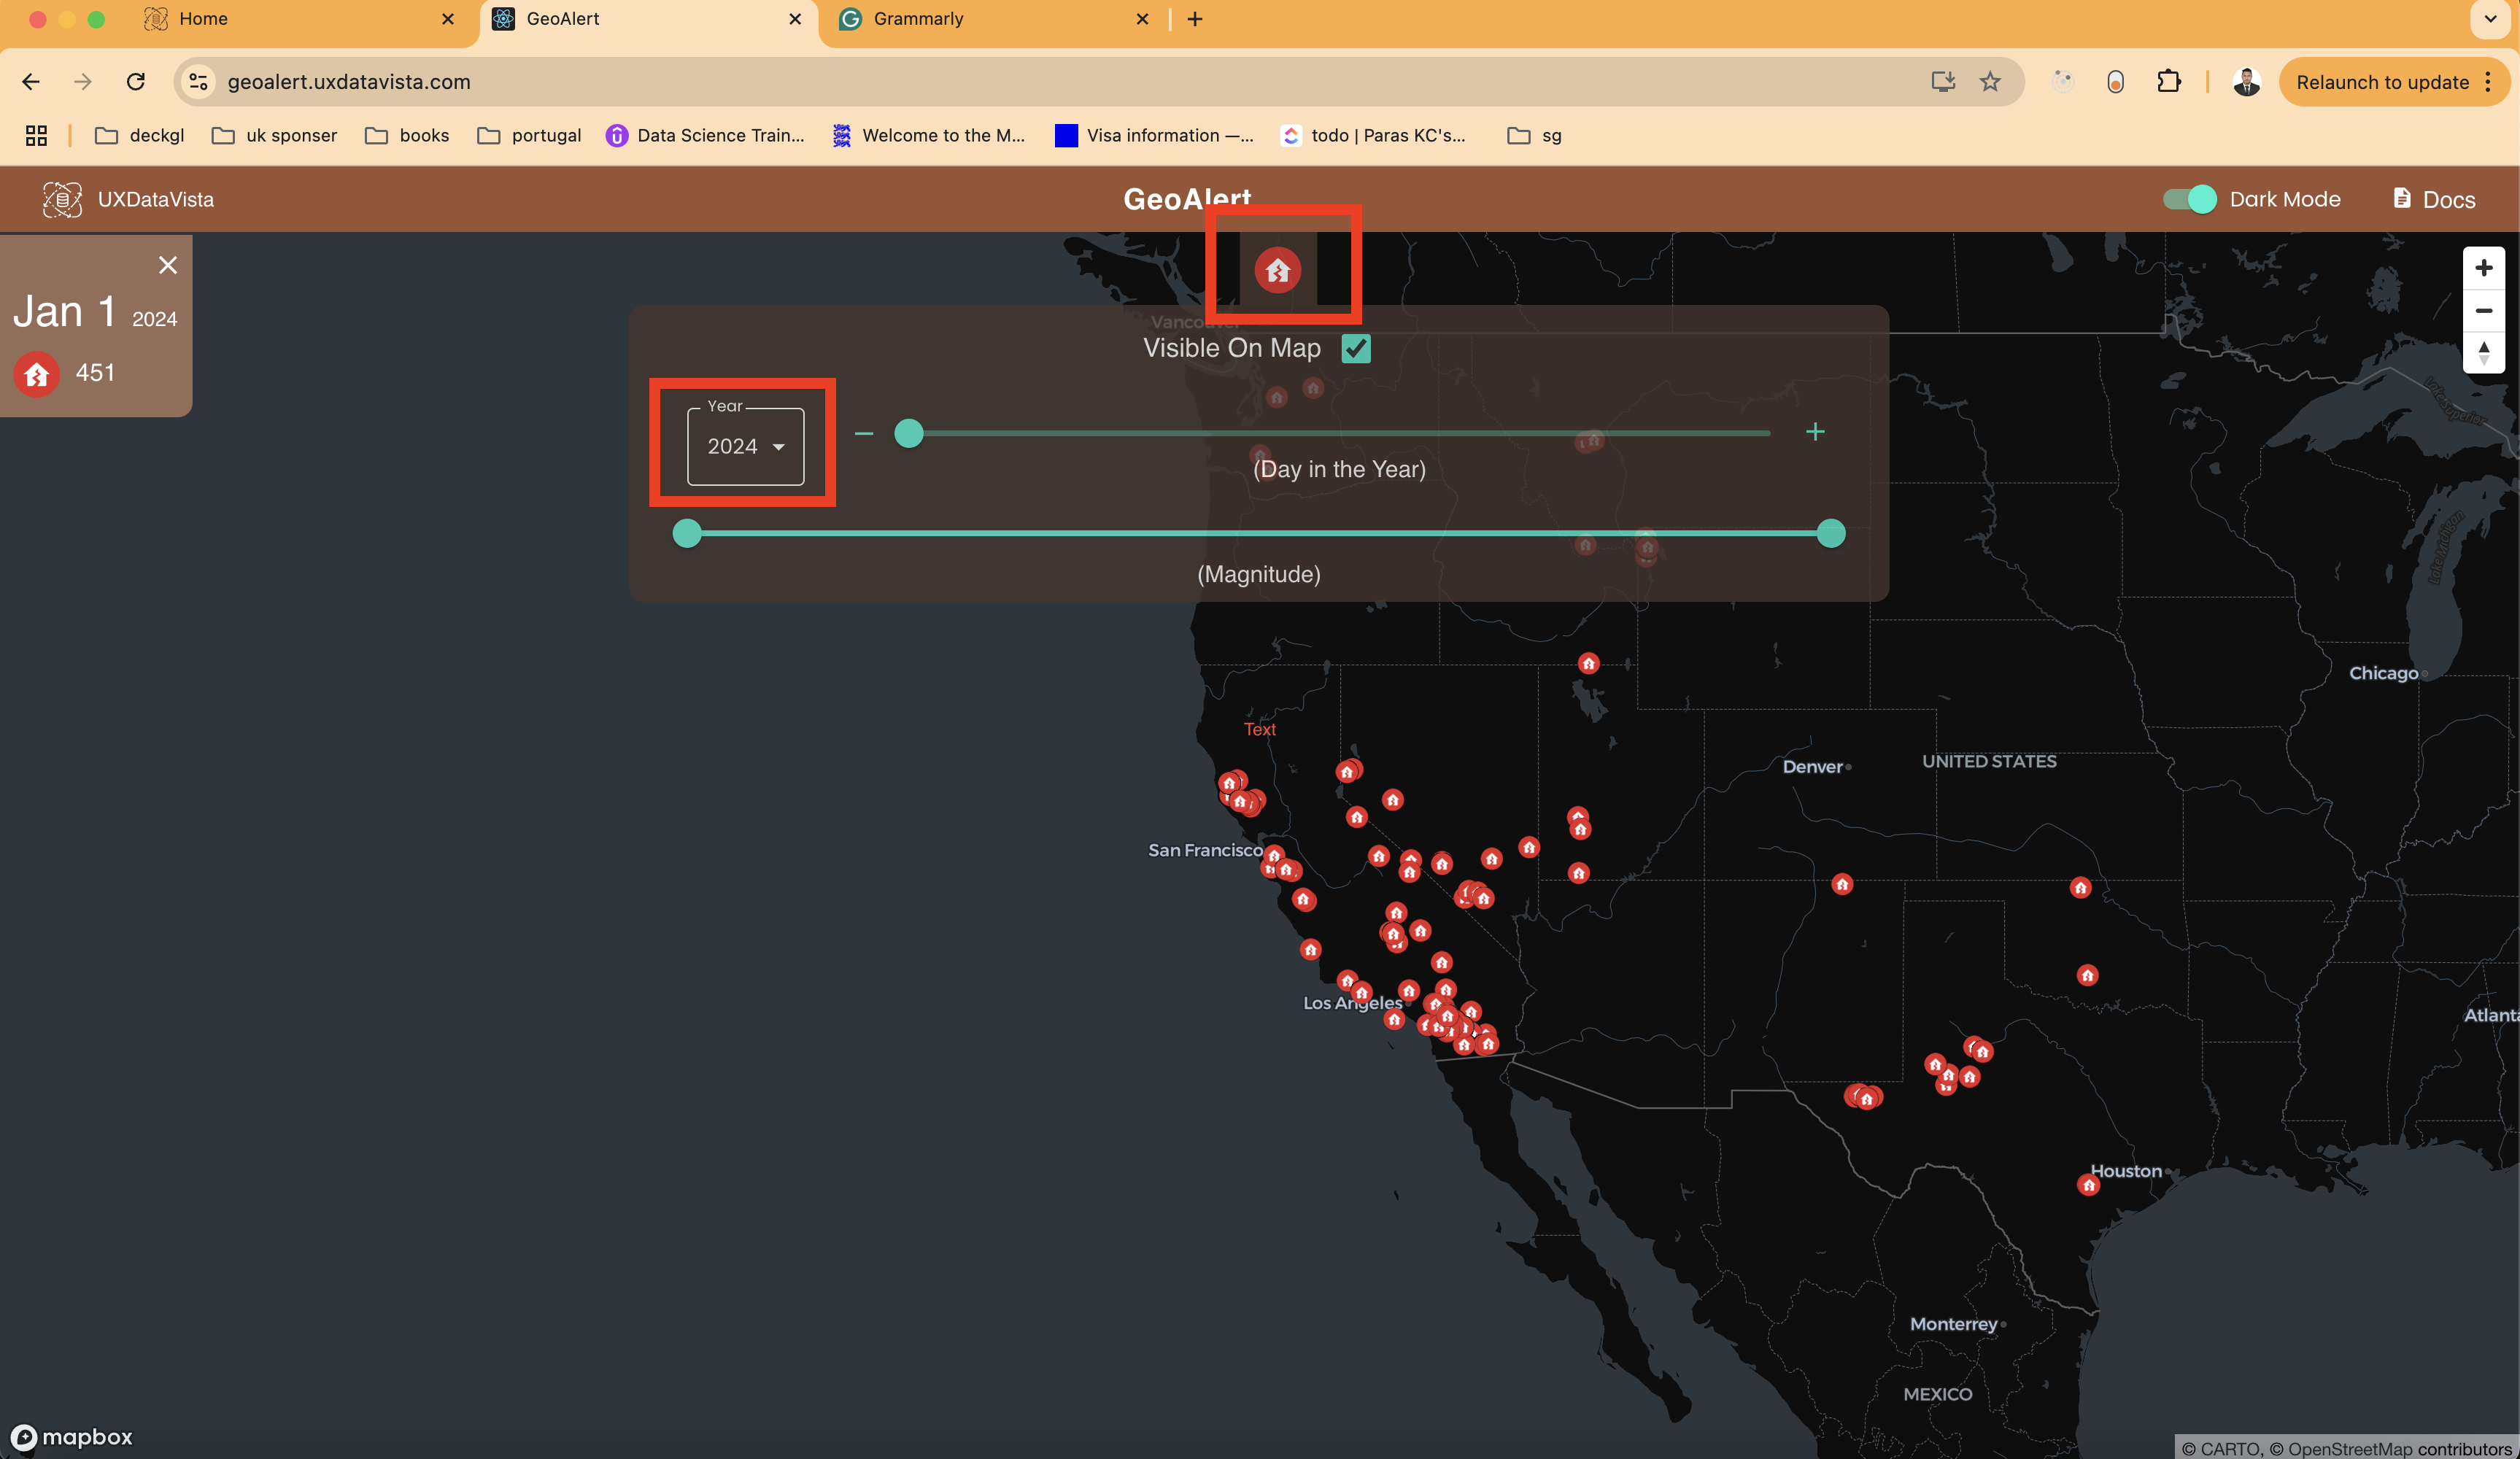
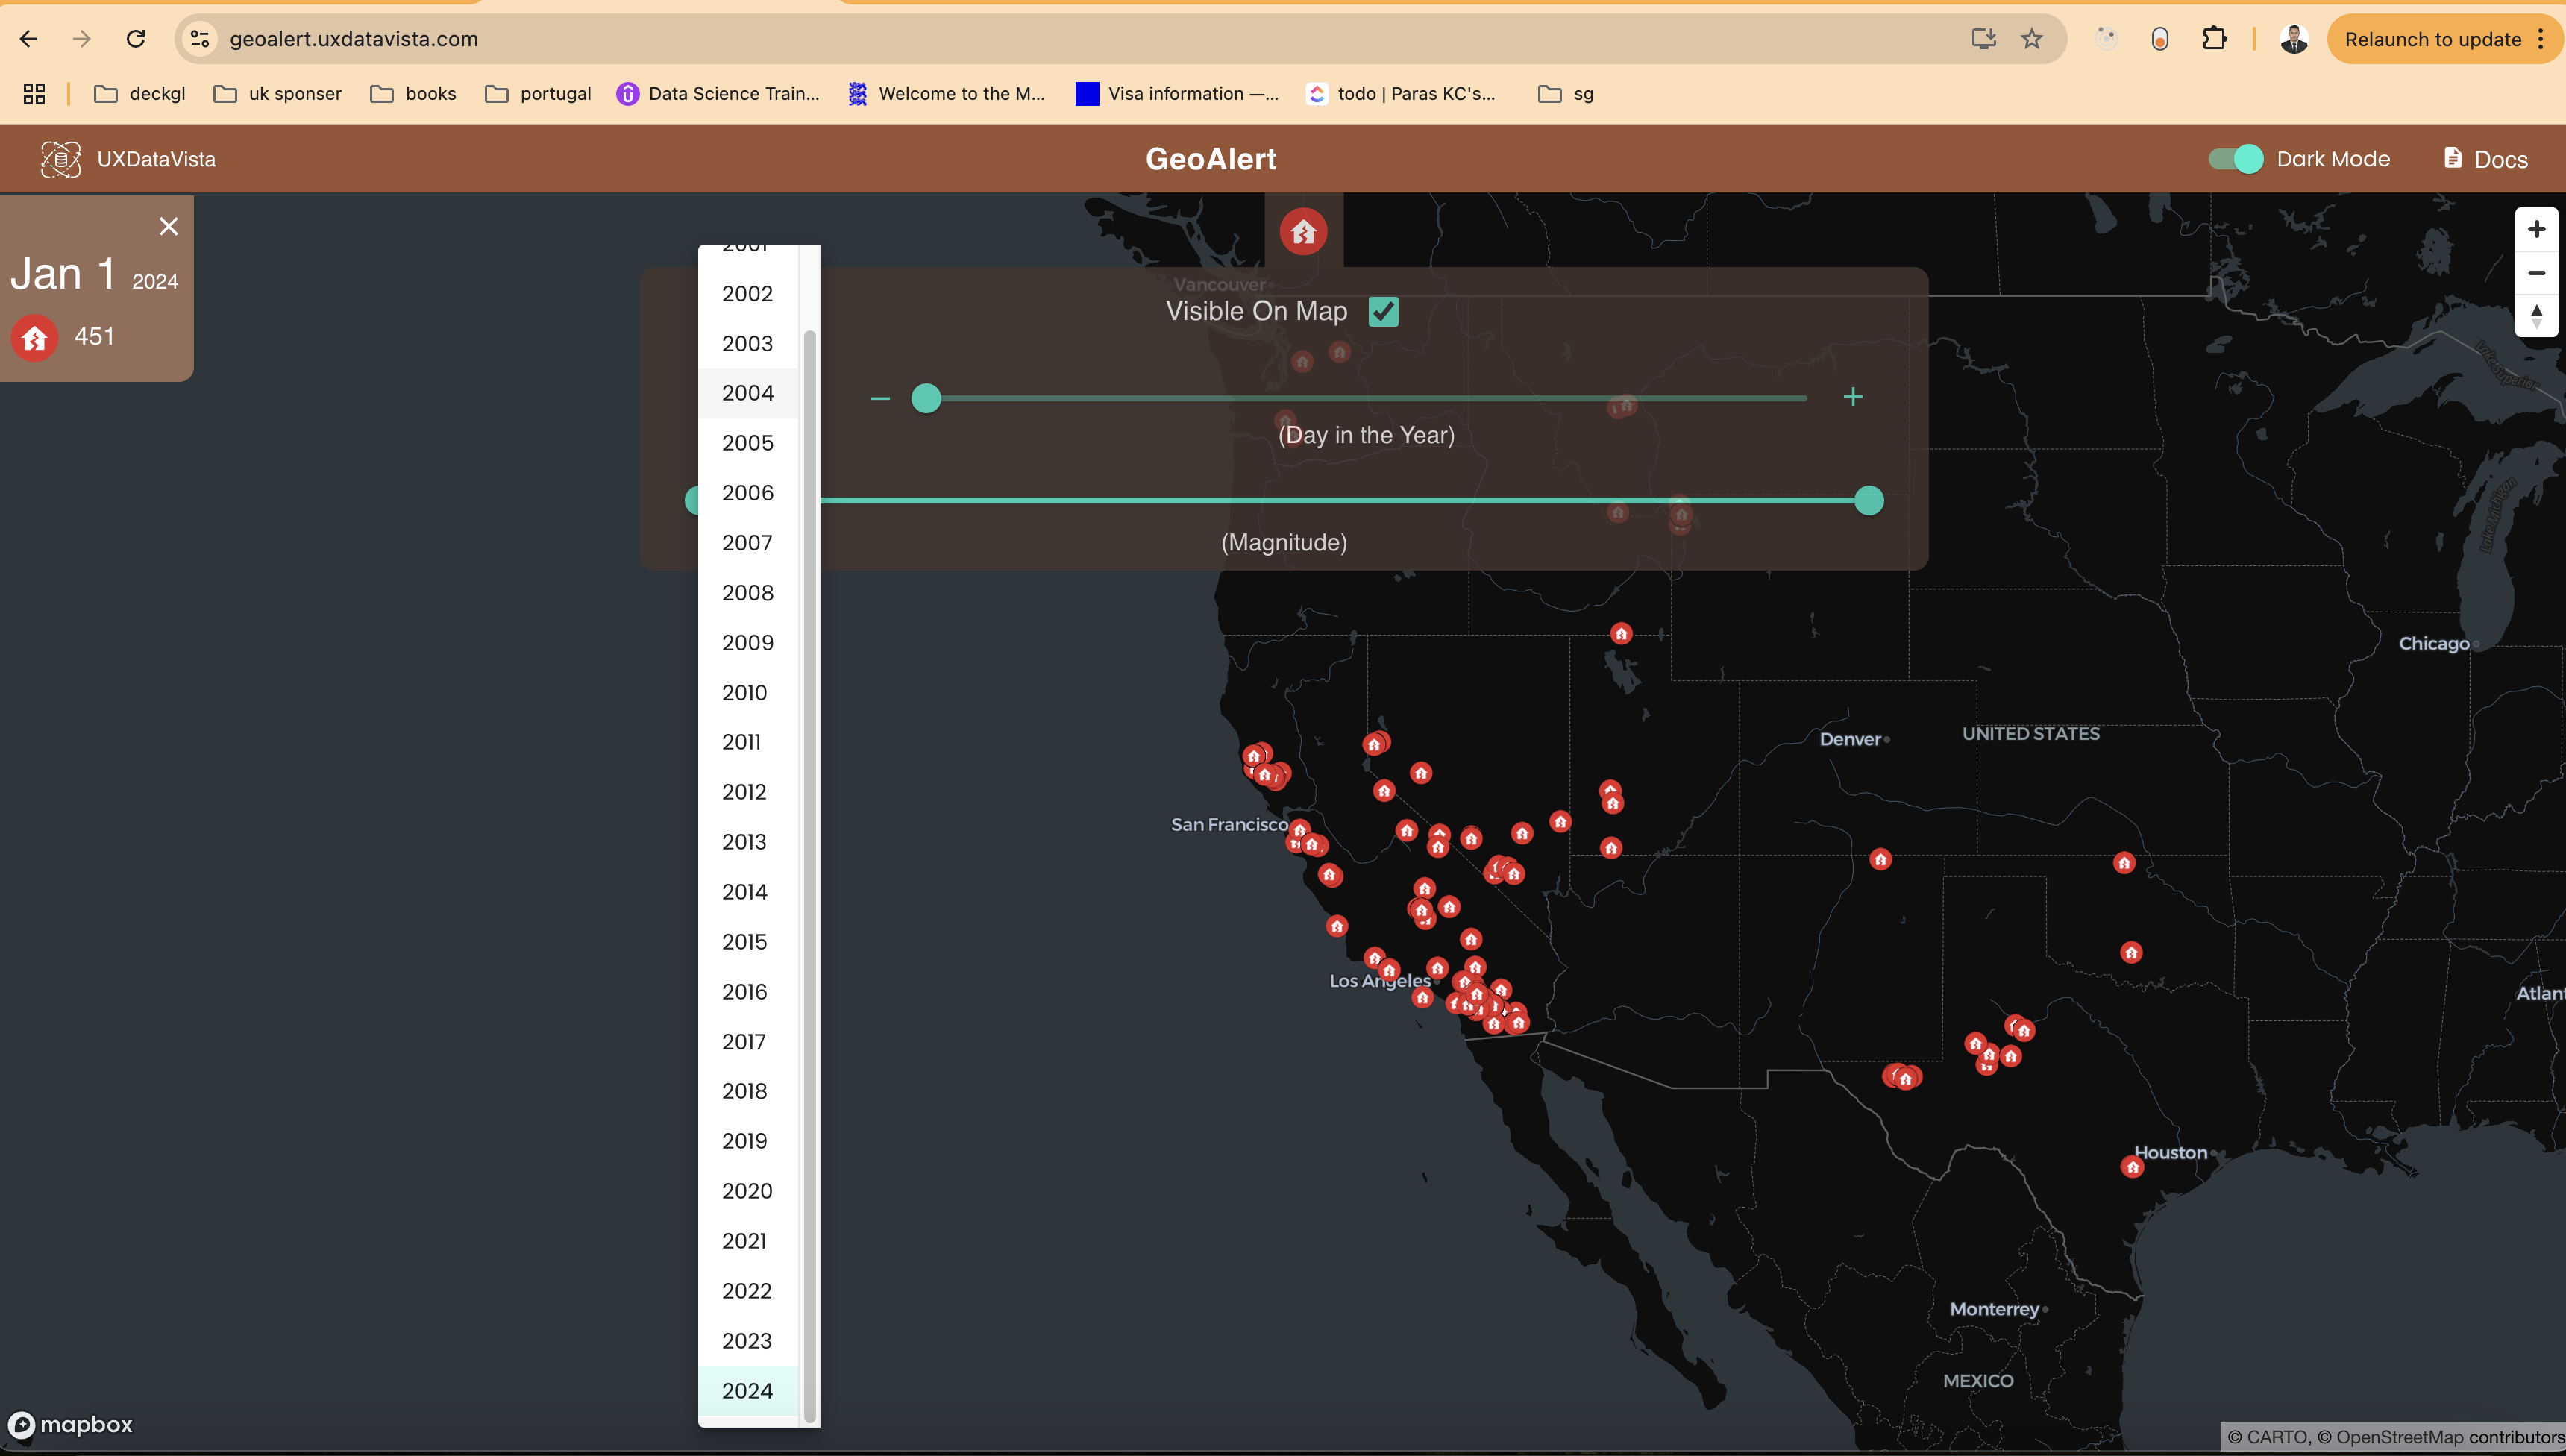
By default data for 2024 will be loaded, click on the earthquake Icon, then the date picker to select a different year
Step3:
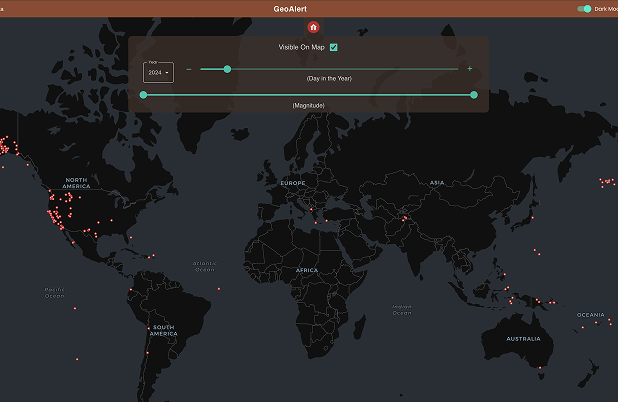
Slide through the date silder, to pick the date you want the data for

Step4:
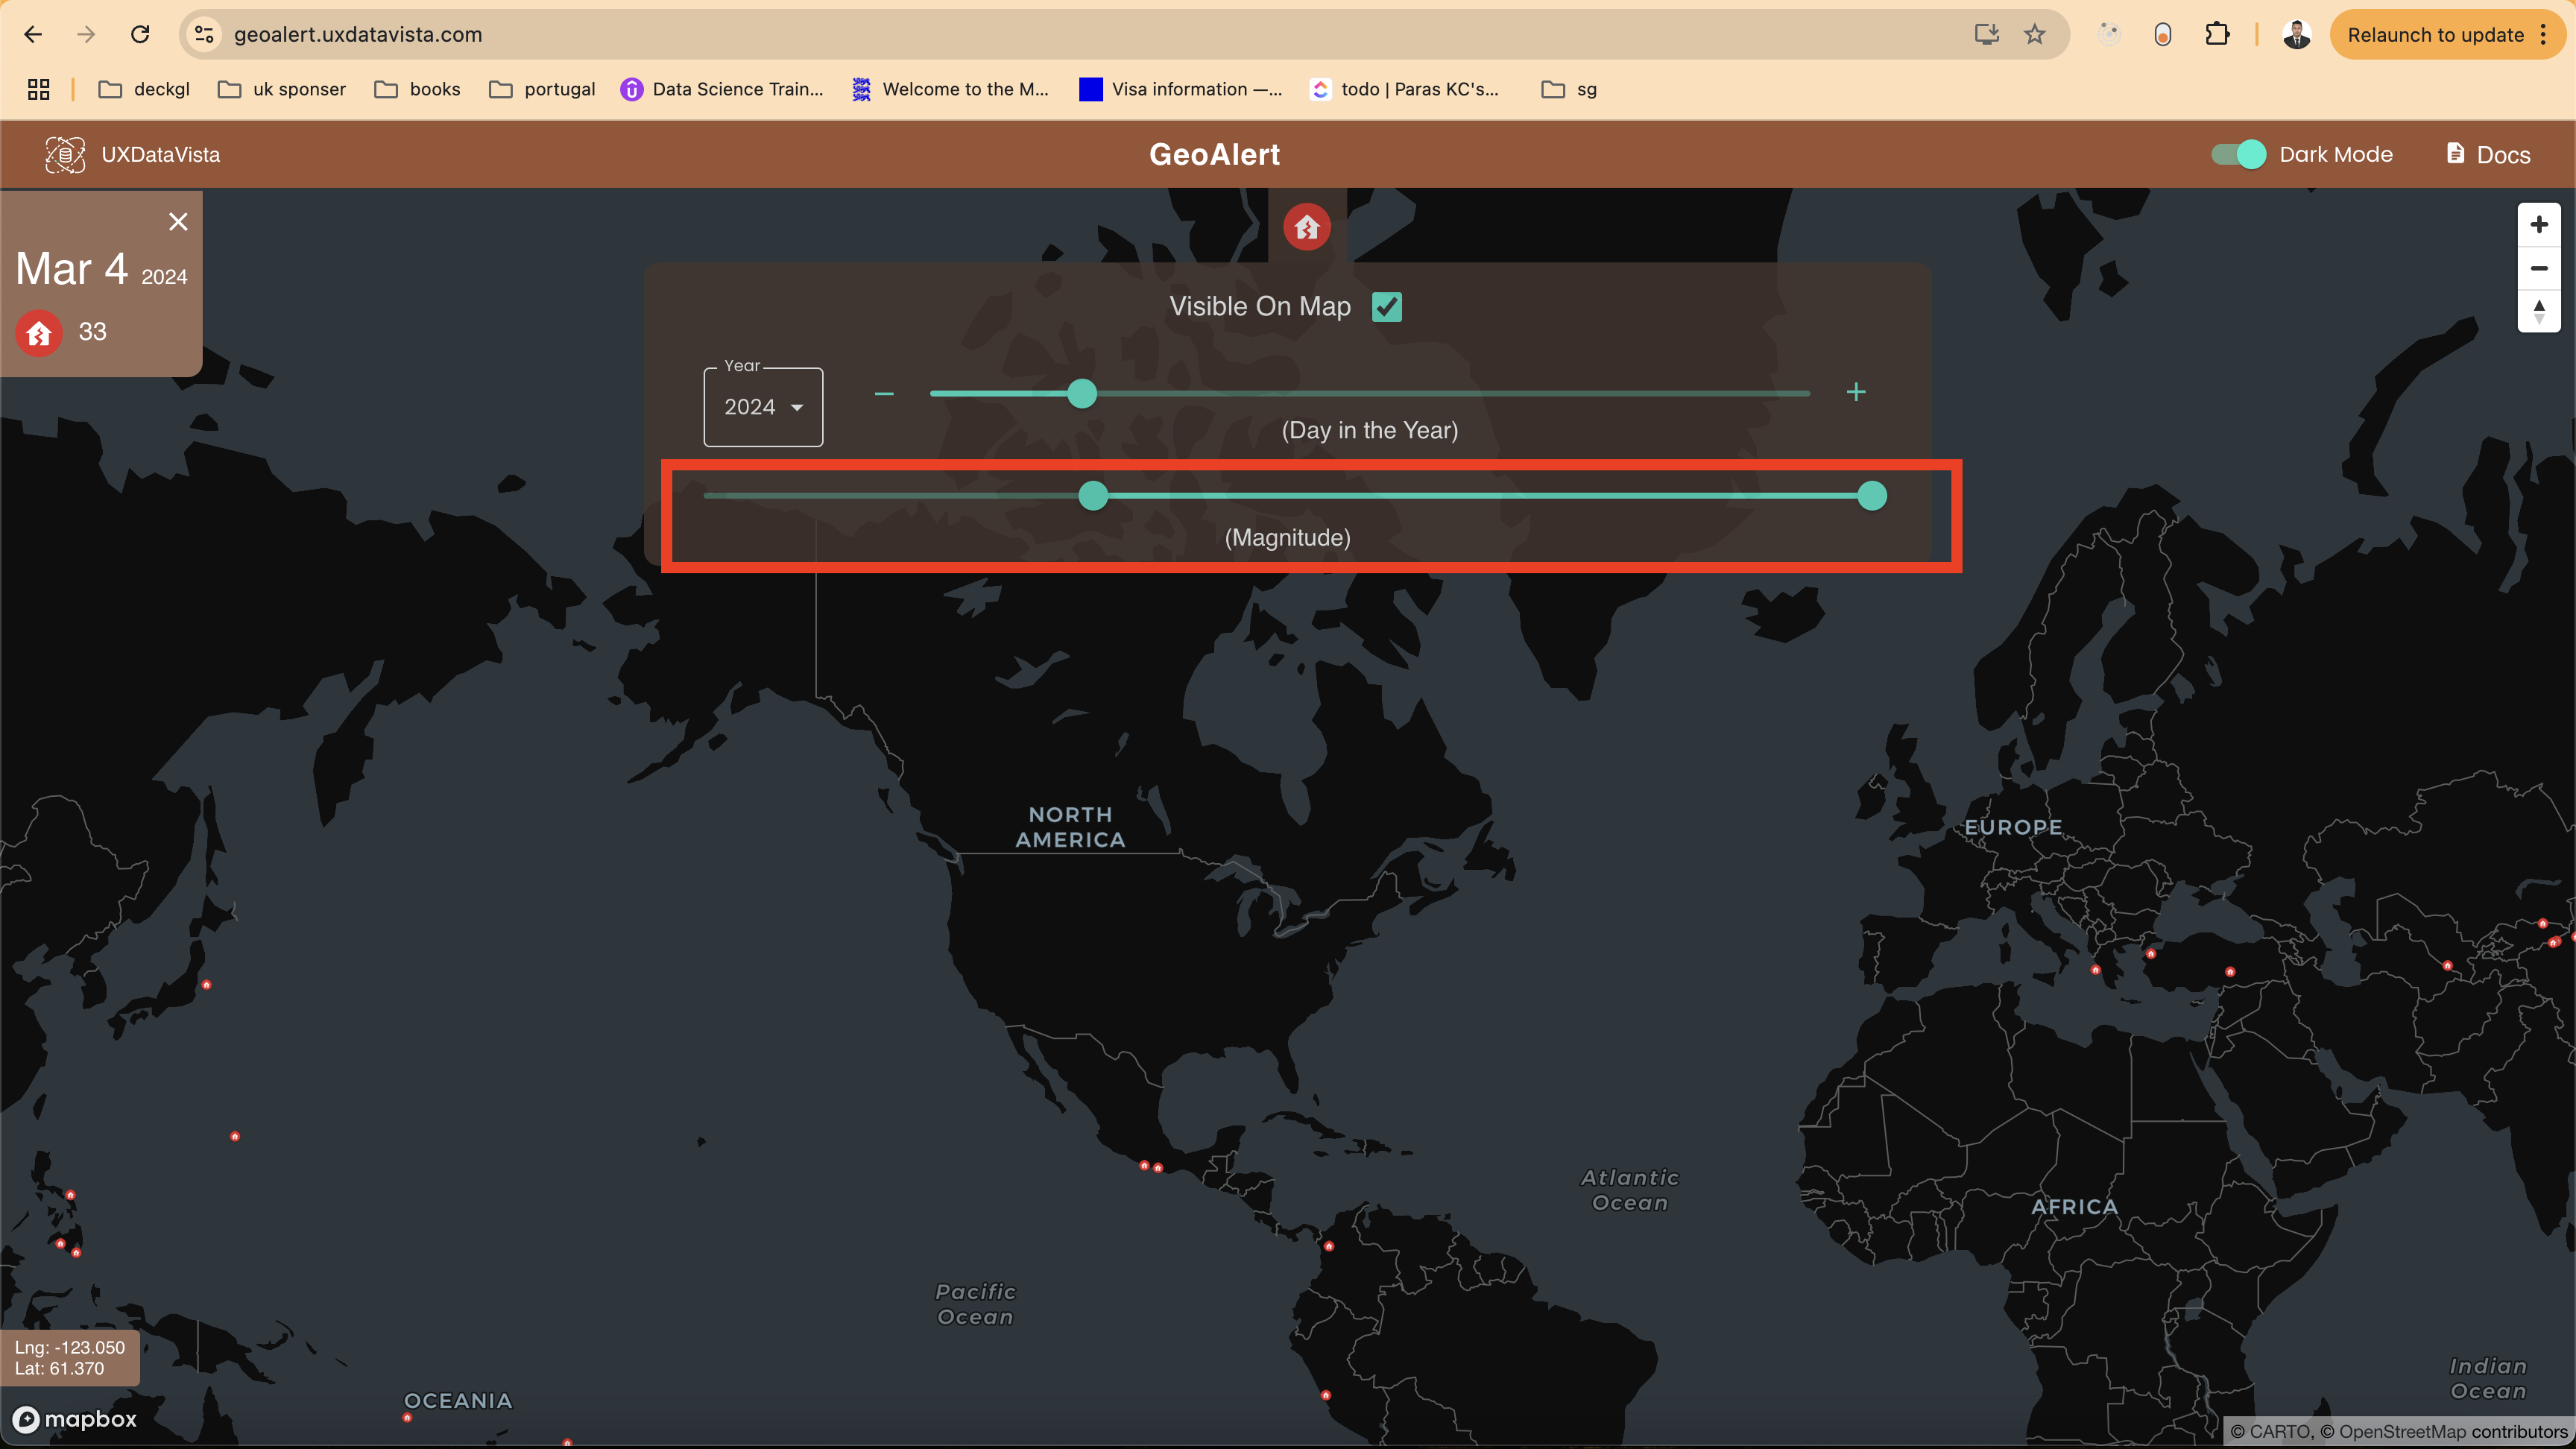
Adjust the Magnitude to further filter the data
Step5:
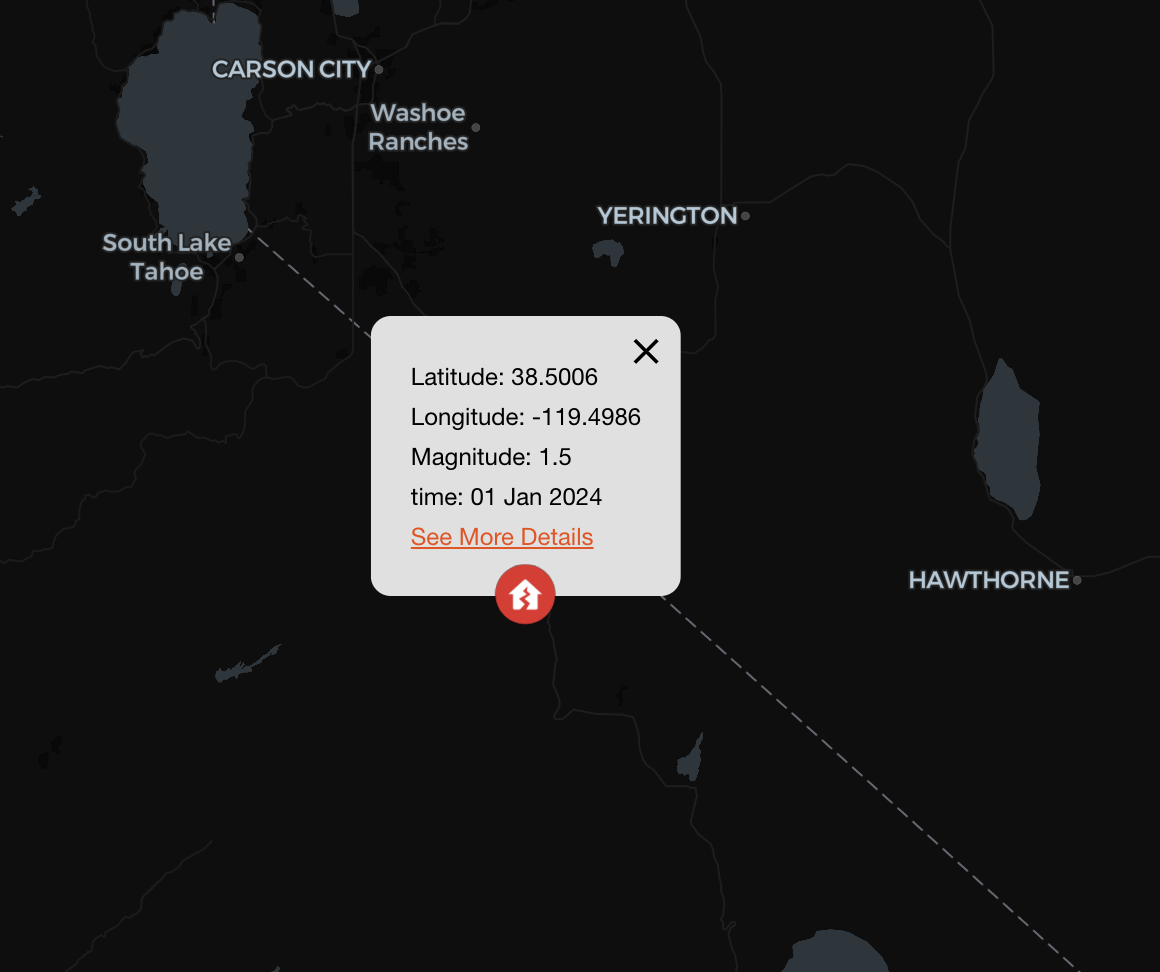
Click on the icon to get details about the specific event, and click on "See More Details" to get more data