Organizational Chart
Create an organizational chart for your company using our free, easy-to-use, intuitive tool: orgChart
Go To AppWhat is an organizational chart?
It is a chart that highlights a company’s hierarchy. It shows different departments, the relationship between those departments, and the respective team leads and team members for each of those departments
Steps to Create an Organizational chart for your company
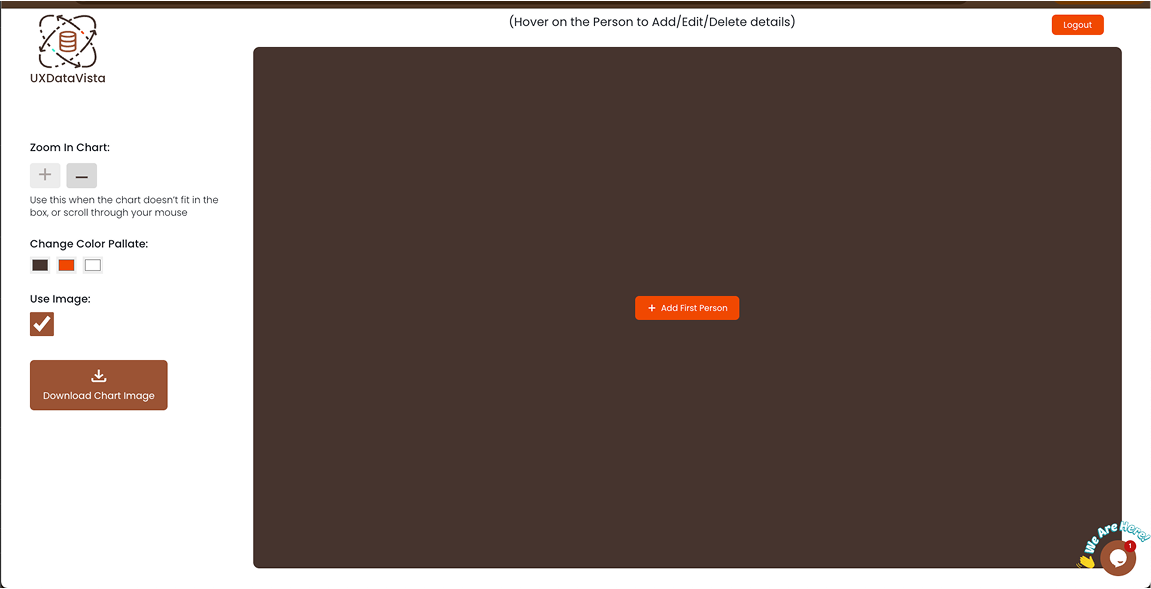
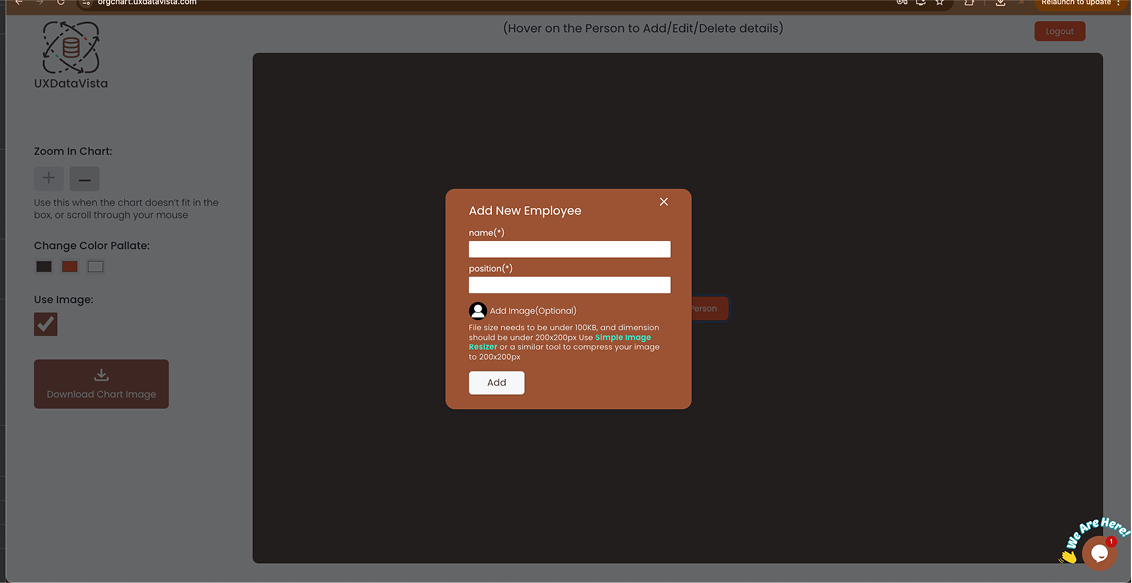
Step2:
Click on “Add First Person”, then you will get a pop-up where you can add name, position and an image, make sure the image is under 100kb and its dimension is about 200x200px. Use Simple Image Resizer or a similar tool to resize your image.
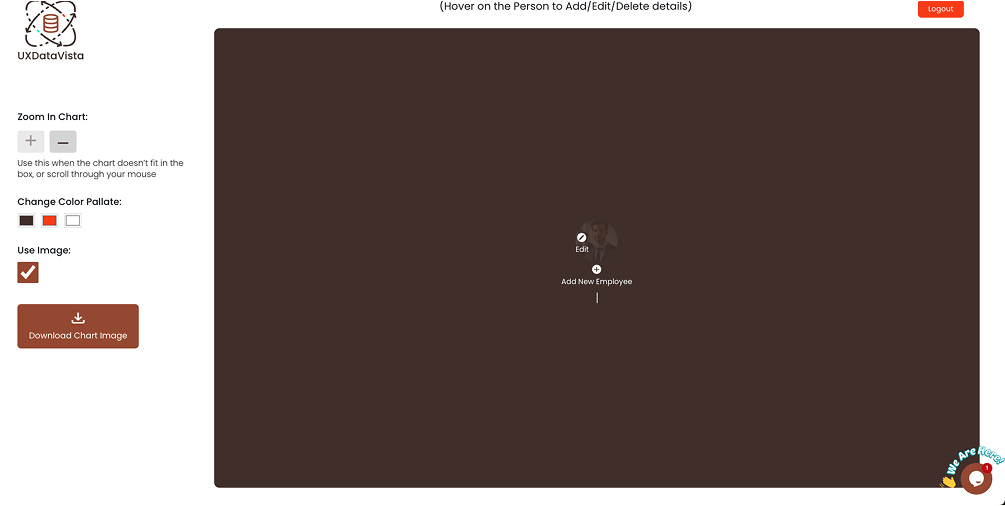
Step3:
Move your mouse over to the person you just added, and then you’ll get the option to “Add New Employee”. Click on it and then you’ll get an identical pop up as before, which you can then use to add details for the new person
After adding 3 people:
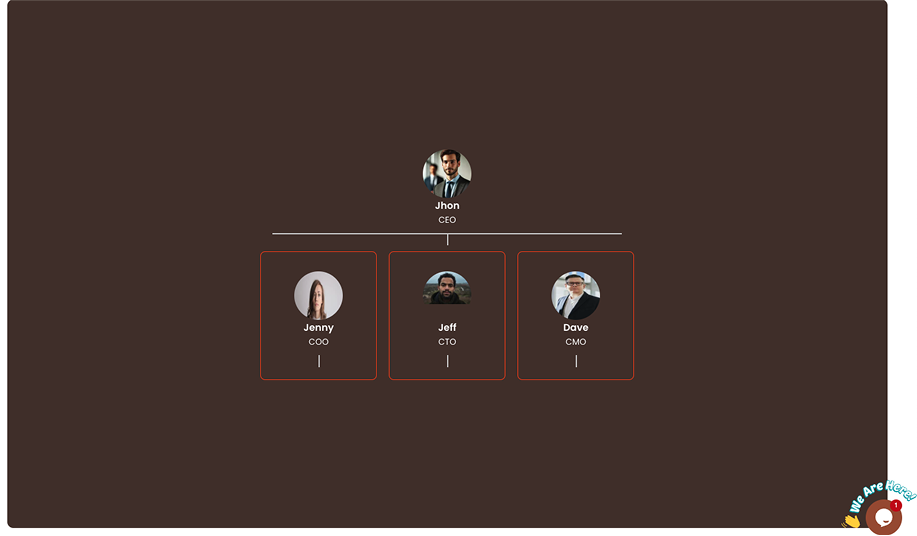
Step4:
Now You can continue adding more people to each team by hovering on the person, under whom you want to add team members.
example: 20 person team
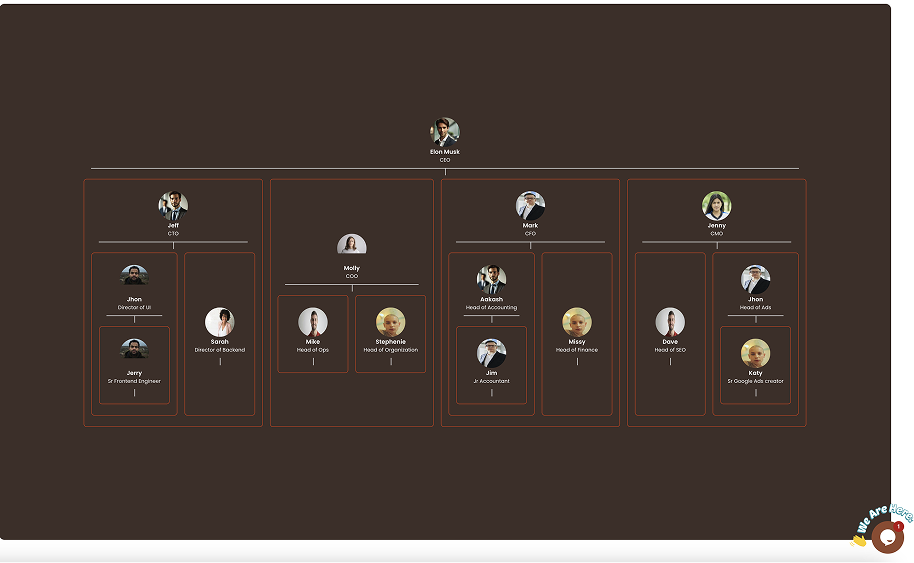
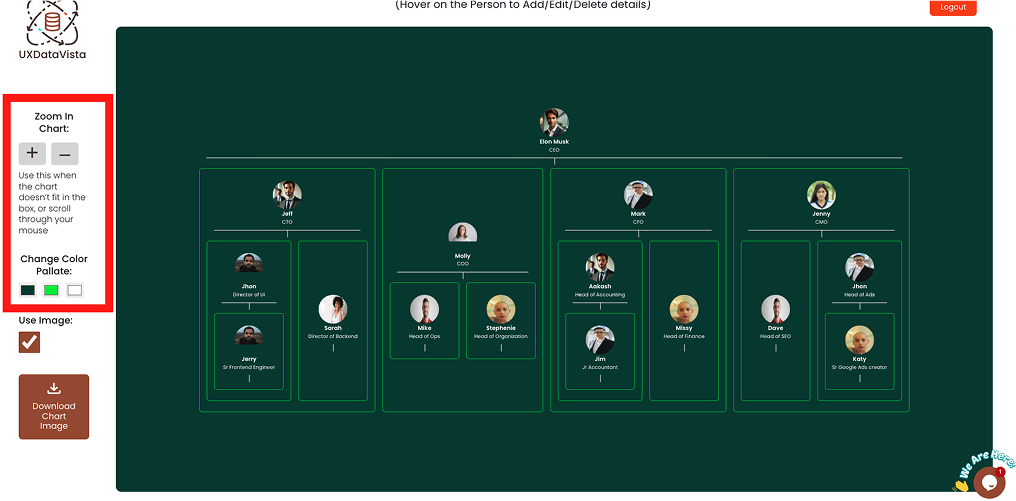
Step5:
Adjust the setting to your liking: You can click the zoom in/out button to resize the chart if it's overflowing. And you can also add your brand colors.
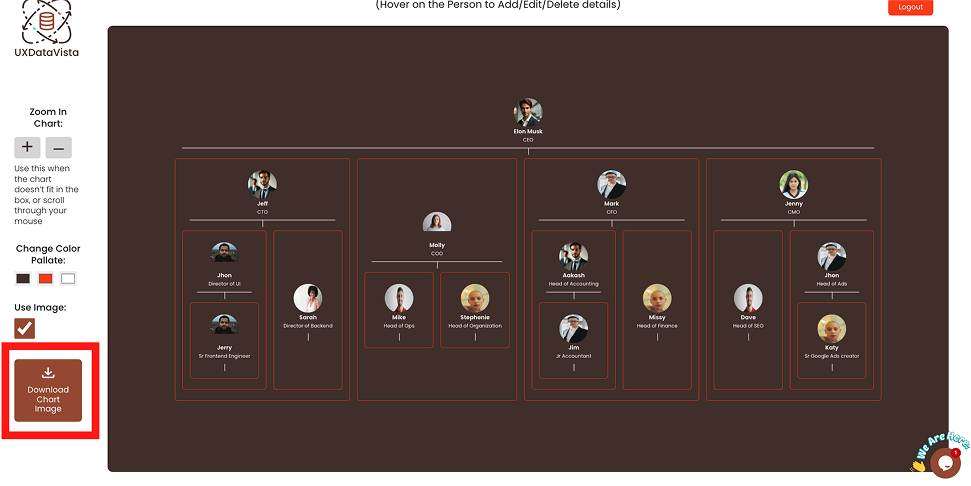
Step6:
Download a High Quality Image for your organization chart.
Why use our Tool to build your organization’s chart?
1> Free, Easy and Intuitive Chart creator
2> Advanced Features
You can readjust your chart as explained in step5, you can also pick your own colors, and download High Quality image of your chart
2> Help available
If you have any problems while creating your Organization’s chart, or if you have feature request, you can message us using the built-in chat window at the bottom right, or you can contact us at info@uxdatavista.com