How To Create an Org Chart in Excel | Templates Included

Organizational chart also known as a hierarchy chart or an organogram is a chart that represents your company’s hierarchy, showcasing different departments, departments heads, and team members.
There are many ways to create an org chart, one of those ways is to make it in Excel, and that’s what I’ll be showing you in this blog.
Before we move forward, I recommend you take a look at our Free, Easy-To-Use, and Intuitive Org Chart Creator, which is a lot simpler to use and has a lot more features than Excel.
With that being out of the way, let’s get started on creating an org chart for your organization in Excel. I’ll show a step-by-step process and at the end, I’ll put some templates for you as well.
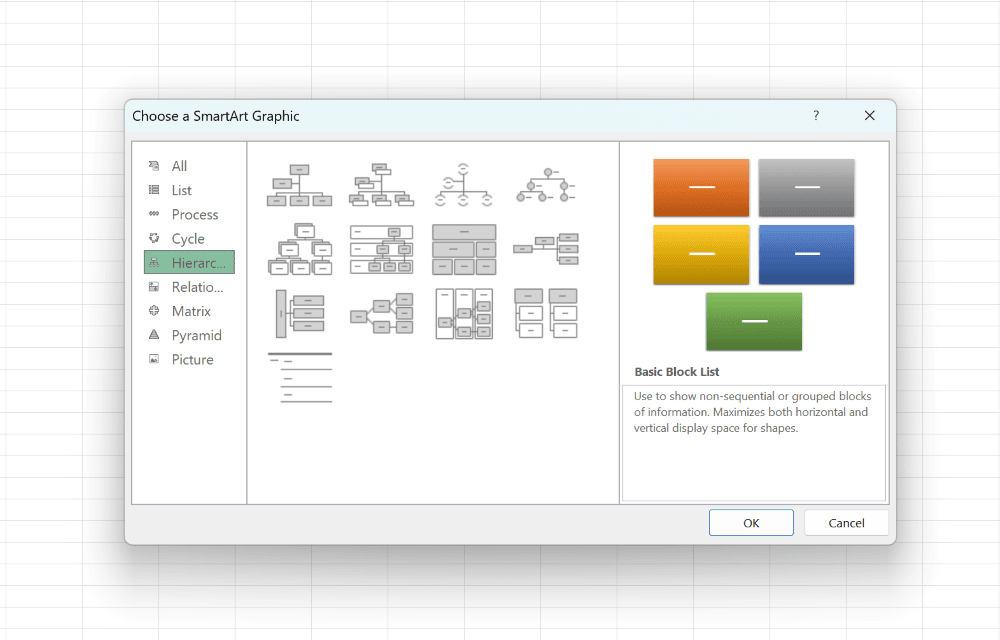
Step One: Create a new Excel file and locate smartArt

Step Two: Click on "Hierarchy" and then pick the chart you like"
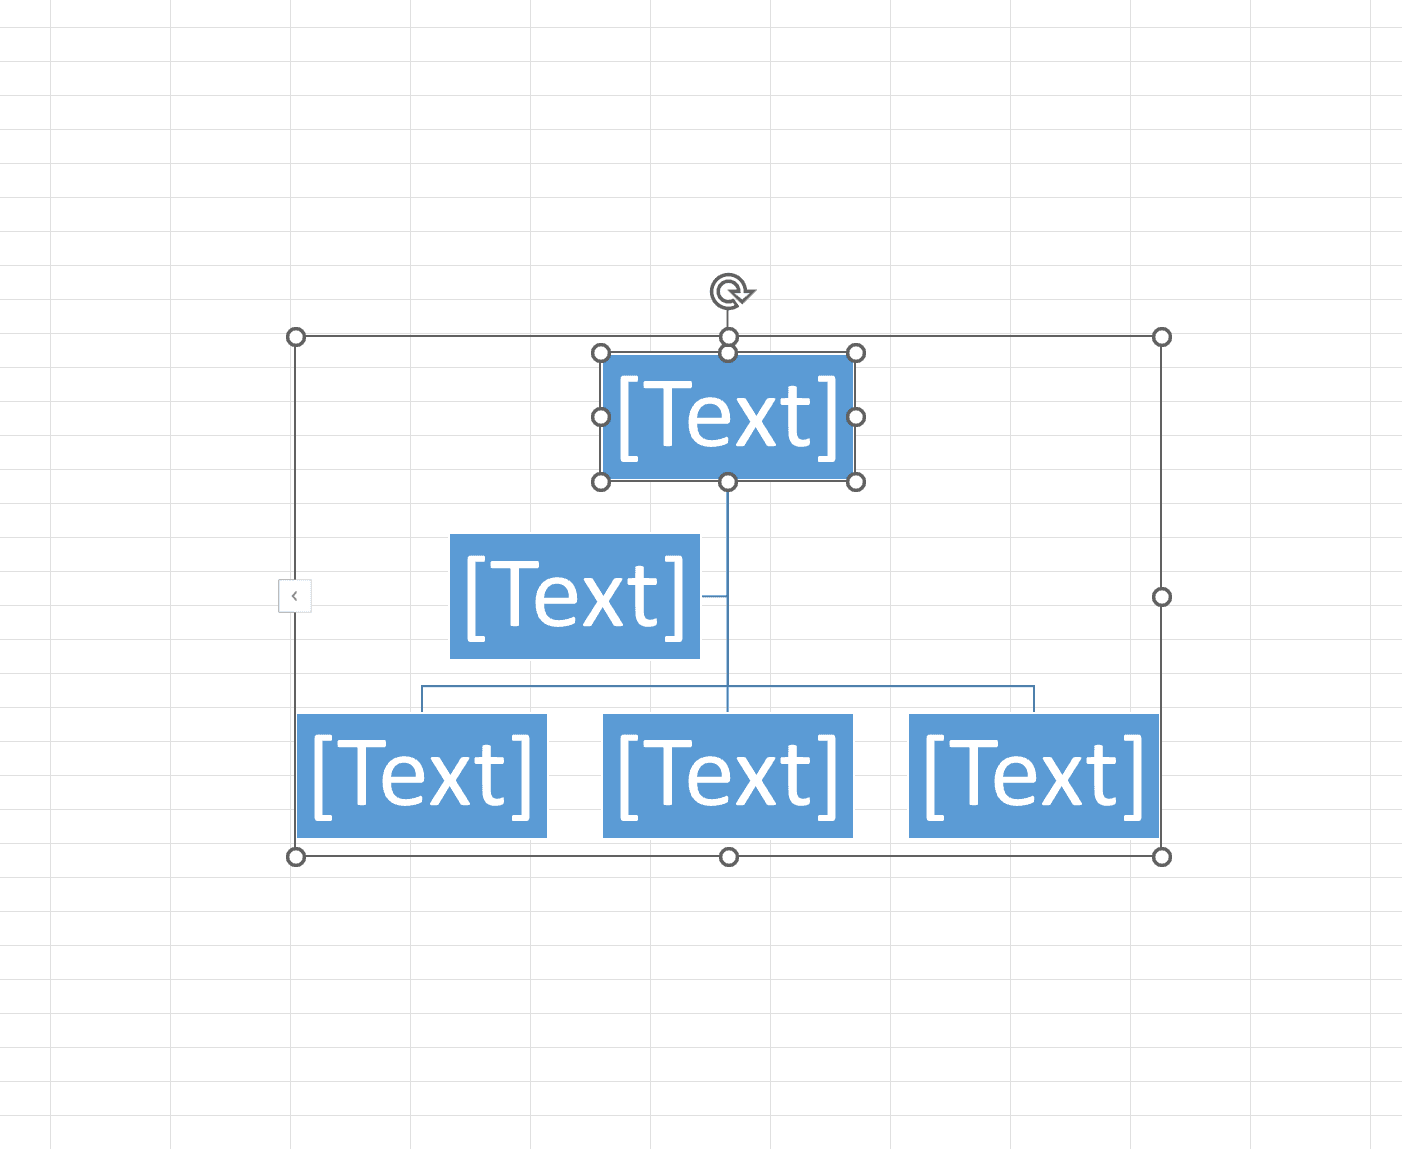
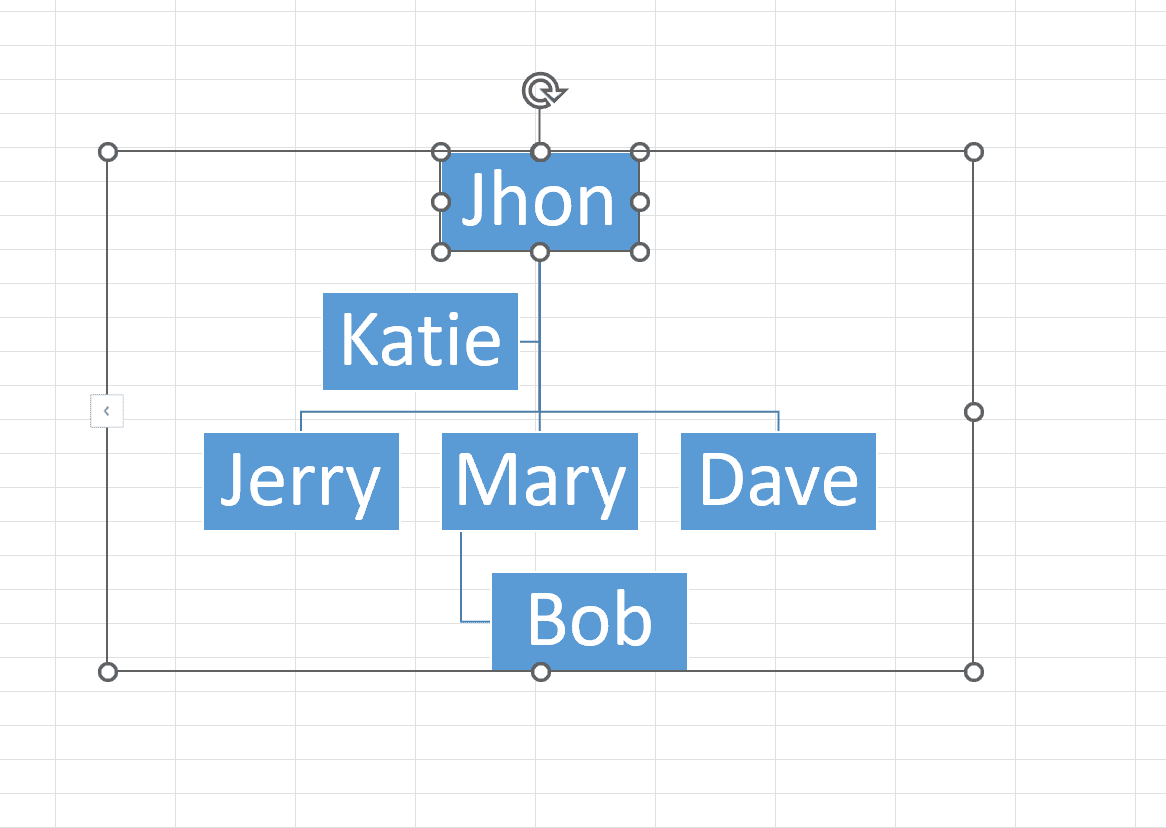
Step 3: Click on the boxes to add details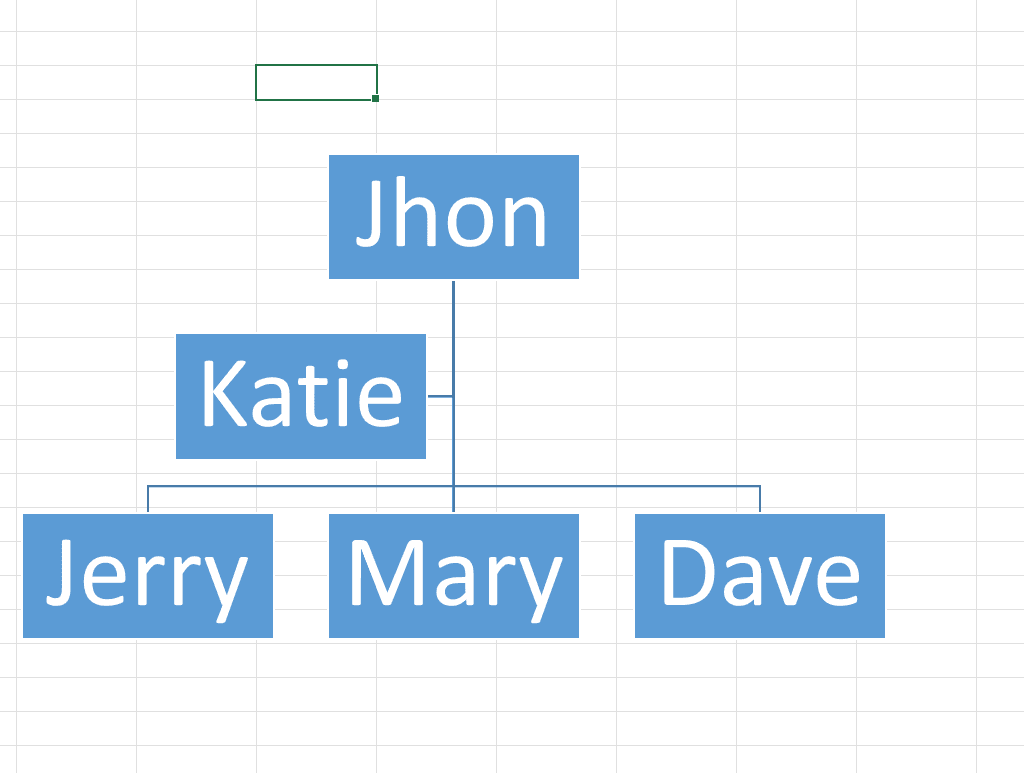
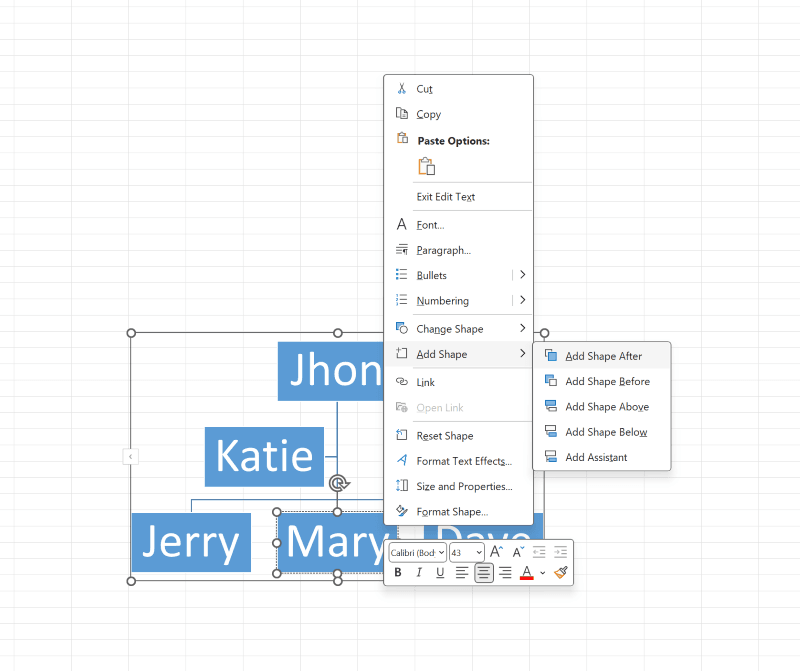
Step 4: Right Click on any box and click on "Add Shape" to increase the Hierchy as you see fit
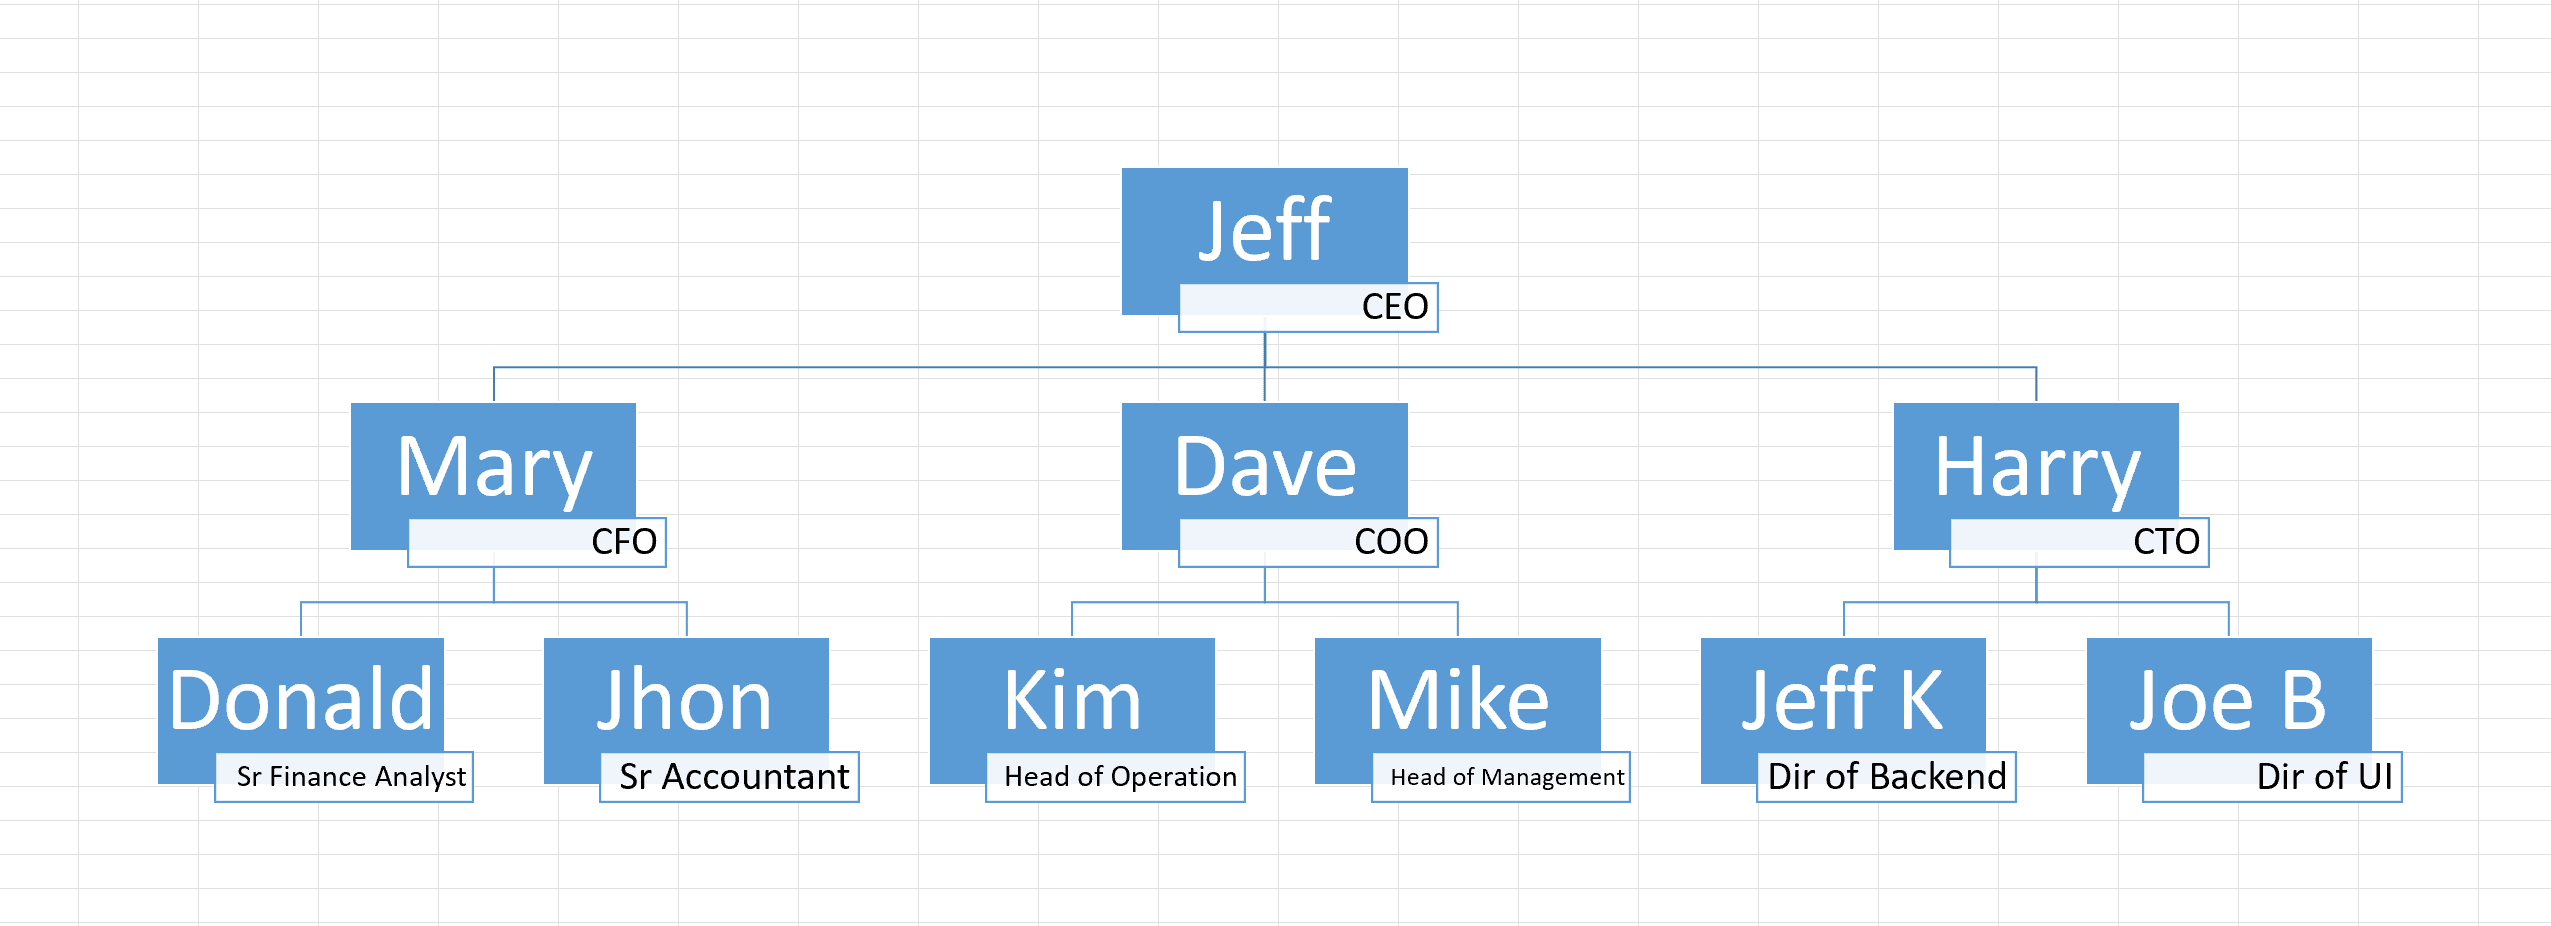
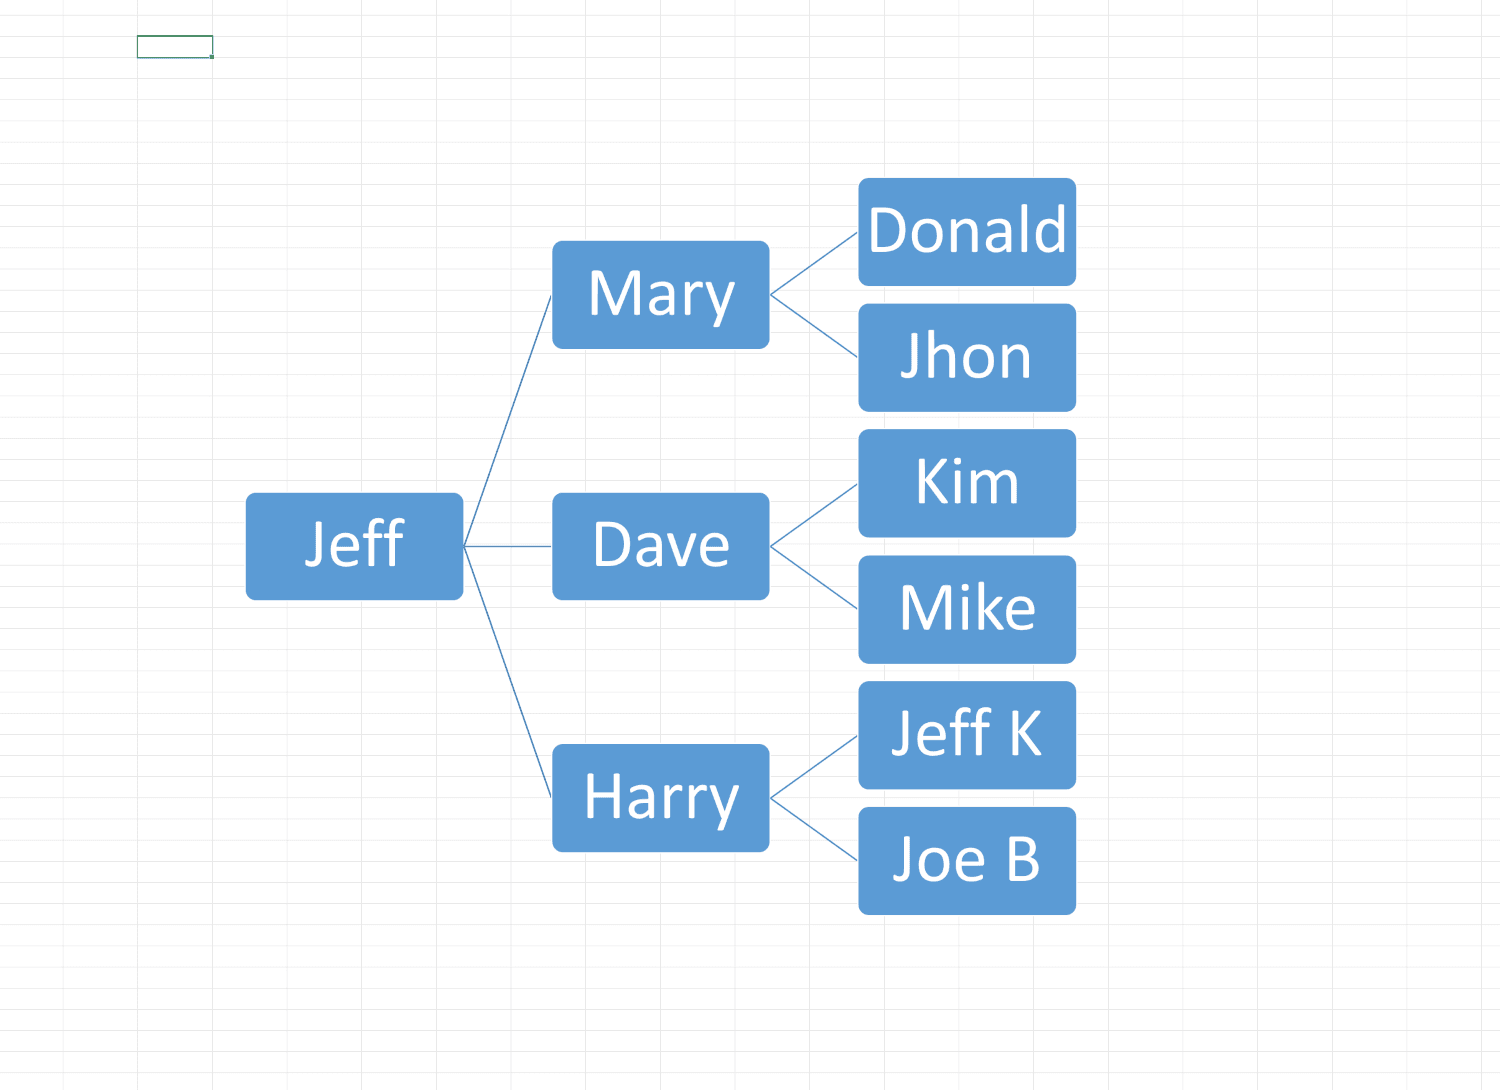
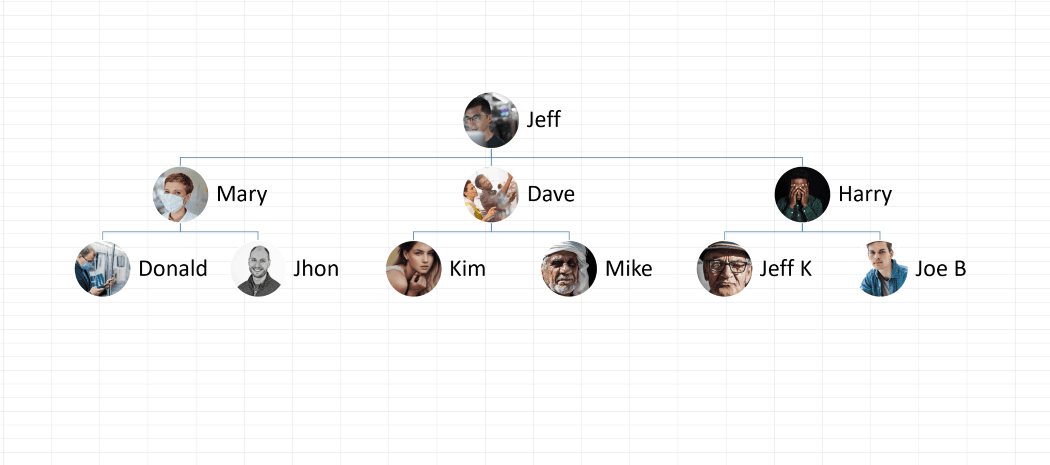
Some templates you can use as a base for your chart:

That's all for today, hope you found value in this. Please check out OrgChart if you want to build more complex organizational chart in a easy and intuitive way.